Defining Your Pipeline
When constructing your pipeline, the use of Node and Graph will largely contribute to the data flow and processing. This is done through the representation of a directed acyclic graph, meaning a graph with edges with a direction that do not make a cycle. If a cycle is detected, then ChimeraPy will not allow you to register the graph. Regardless, there are some visualization tools to help construct a graph.
Instantiate Nodes
To define you DAG, first create the nodes that will populate the DAG:
import chimerapy.engine as cpe

a = cpe.Node(name="a")
b = cpe.Node(name="b")
c = cpe.Node(name="c")
d = cpe.Node(name="d")
e = cpe.Node(name="e")
f = cpe.Node(name="f")
For now we are just going to use empty Node for illustrative purposes, but in your own implementation, these nodes would include sensor collecting, processing, and feedback.
Add Nodes to Graph
After creating the Nodes, we add them to the Graph, like this:
graph = cp.Graph()
graph.add_nodes_from([a,b,c,d,e,f])
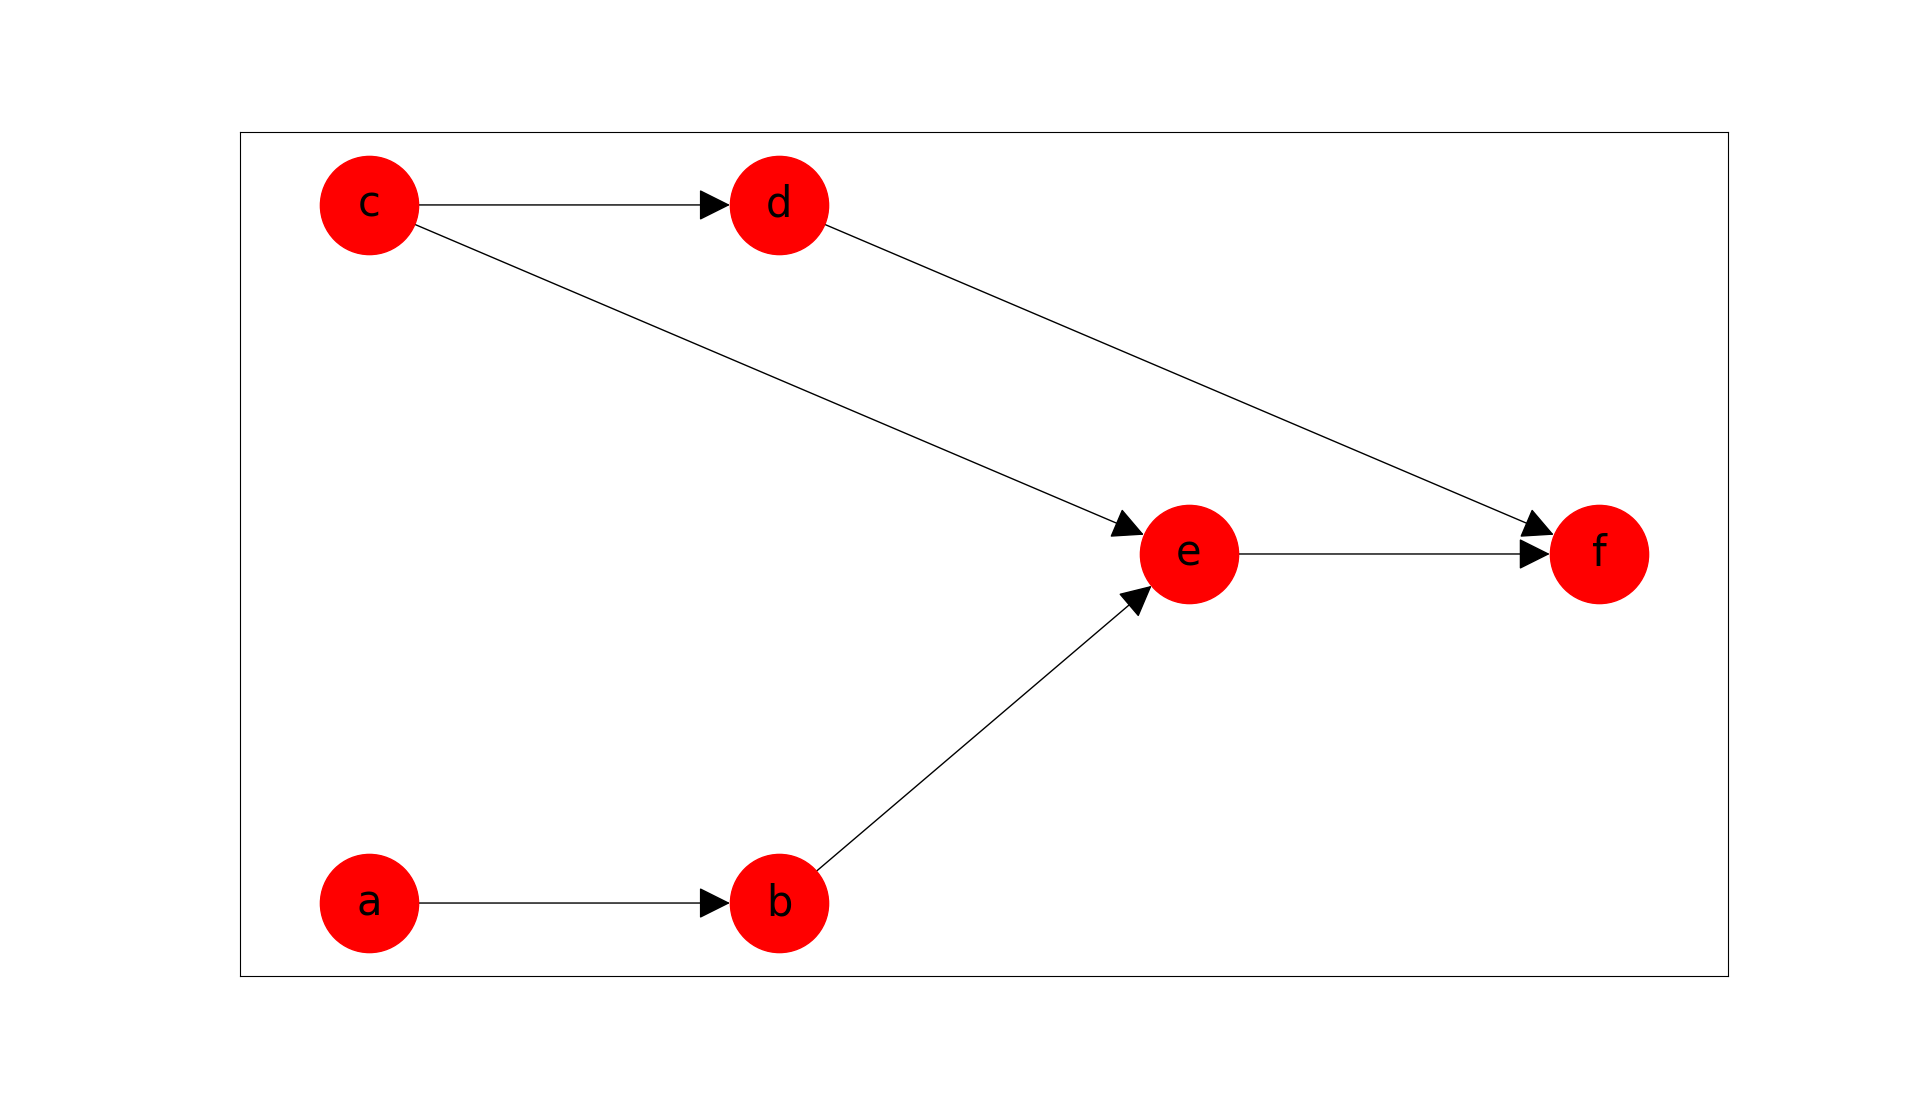
graph.add_edges_from([[a, b],[c, d], [c, e], [b, e], [d,f], [e,f]])
Handling Frequencies
When defining a pipeline, the sampling frequency of Nodes needs to be considered. An example where frequency can cause havoc is when two or more Nodes that feed into a single consumer node have high frequency. To avoid data loss, the consumer node would need to execute its own step function at the summative frequency of all incoming nodes. This would put a large computational burden on the cluster and could lead to system failure. There are counter measures to avoid this issue, by specifying which incoming Node should a consumer Node follow. Following refers to that the consumer Node will only execute its step function when it receives data from the Node that it is following. Effectively the escalating frequency crisis is averted. Declaring followship is shown below:
hf = HighFrequencyNode(name="hf")
lf = LowFrequencyNode(name="lf")
sn = SubsequentNode(name="sn")

graph = cp.Graph()
graph.add_nodes_from([hf, lf, sn])

graph.add_edge(src=hf, dst=sn) # By default
graph.add_edge(src=lf, dst=sn, follow=True) # <- Overwriting to lf
By default, the first producer node to a consumer is followed, in this case it would be the HighFrequencyNode. To change it, we overwrite this by adding the follow parameter when adding a edge between a producer and consumer nodes.
Check Graph
With the graph configuration complete, we can visually confirm that the DAG is constructed correctly, by using the following command:
# Should create a matplotlib figure
graph.plot()
This creates the following plot: